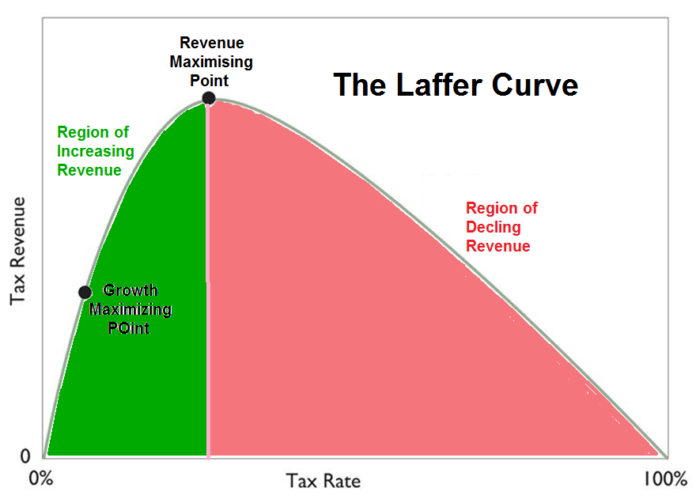
Can a government put tax rates up and collect less money? The answer is yes. Whether a particular tax has reached that point is the more difficult—and rather more expensive—question.
1. The curve behind the joke
The Laffer curve is named after Professor Arthur Betz Laffer, the American economist who popularised the relationship between tax rates and tax revenue. His academic career included the University of Chicago, the University of Southern California and Pepperdine University. He obtained his economics doctorate from Stanford University in 1972 and served on President Ronald Reagan’s Economic Policy Advisory Board from 1981 to 1989. His biography is available from the Laffer Center.
The central idea is straightforward. Increasing a tax rate initially raises more money. But if the rate becomes sufficiently high, taxpayers’ responses can shrink the amount being taxed so much that revenue falls. A Chancellor can announce a higher percentage; collecting a higher total is another matter.
The graph illustrates that possibility. It does not tell us where Britain sits on the curve, and there is no single curve covering every tax and every taxpayer. Nor does the revenue-maximising point necessarily represent the best tax policy: growth, fairness and the public services financed by tax also matter.
2. When does another hour of work stop being worthwhile?
There is no universal tax rate at which everyone puts down their tools. Motivation, household needs, health, age and the value placed on free time all matter. So does what the worker intends to do with the money left after tax. Someone paying the mortgage may keep working despite a high marginal rate. Someone whose essentials are covered may decide that another afternoon with the family is worth more than the net proceeds of another job.
Some people may even work more to maintain their disposable income. Others cannot readily change their contracted hours. The relevant question is usually the marginal burden—how much of the next pound is lost through tax and other withdrawals—rather than the average tax rate on income already earned.
Responses also extend beyond hours worked. People may contribute more to pensions, retain profits in a company, change the timing of dividends or disposals, or move abroad. The major research review by Saez, Slemrod and Giertz (2012) stresses this distinction: a fall in taxable income is not necessarily a fall in productive work.
3. Two warning signs: taxpayers gathering below thresholds
When taxpayers are plotted by income, concentrations around particular tax thresholds can reveal that the tax system is influencing decisions. Economists call this “bunching”. Two relevant points are the higher-rate threshold and the £100,000 personal allowance taper.
At the higher-rate threshold, some taxpayers arrange matters so that little or none of their income enters the next band. That may involve pension contributions, dividend decisions or, in some cases, turning down additional work. Entering the higher-rate band does not normally mean that all earlier income is suddenly taxed at 40%; the higher rate applies to the slice above the threshold.
The £100,000 point gives a further reason to pause. The personal allowance is withdrawn by £1 for every £2 of adjusted net income above £100,000. With the standard £12,570 allowance, withdrawal is complete at £125,140. For ordinary earnings subject to the 40% higher rate in England, Wales and Northern Ireland, that produces an effective 60% Income Tax rate across this range, before National Insurance or other deductions. Scottish rates differ. See HMRC’s explanation of the rates and allowance taper.
For example, an extra £1,000 in this range can generate £400 of tax on the extra earnings and a further £200 from losing £500 of personal allowance. The worker keeps £400 before other deductions. A pension contribution may instead reduce adjusted net income and preserve the allowance, subject to the pension rules.
There is research evidence for these responses. Adam, Browne, Phillips and Roantree (2021) found bunching at UK tax thresholds, especially among company owner-managers and the self-employed. Their historical data showed little or no bunching among people with only employment income. They also identified bunching at £100,000, but described it as modest; that study does not establish that it was larger than the bunch at the higher-rate threshold.
These are warning signs that incentives matter. They are not, on their own, proof that a tax increase would reduce total revenue. Someone paying more into a pension may still work just as hard.
4. Does the research show higher rates collecting less?
The UK’s former 50p Income Tax rate offers an instructive, disputed example. In its March 2012 analysis, the Office for Budget Responsibility used assumptions implying a revenue-maximising additional rate of about 48%. But it emphasised considerable uncertainty. Later IFS research by Browne and Phillips (2017) estimated a smaller behavioural response, consistent with 50% raising around £1 billion a year more than 45%. We should therefore avoid presenting the 50p experience as a settled demonstration of revenue falling.
A more direct finding comes from France. Lefebvre and Zanoutene’s 2022 working paper estimated that the 2013 increase in dividend taxation reduced dividend payments enough to cause a revenue loss among the wealthy households studied. Additional wealth-tax receipts partly offset that loss. This supports the possibility of a self-defeating tax rise, although it concerns a particular reform and group of taxpayers.
Evidence on actual work effort is more restrained. Martínez, Saez and Siegenthaler (2021) studied temporary Swiss income tax holidays and found very small responses in ordinary wage earnings. Tax planning can respond strongly even when working hours do not.
5. HMRC has already put the possibility in its own figures
This is not merely an argument made by advocates of lower taxes. In its June 2025 illustrative tax-change bulletin, HMRC estimated that a five-percentage-point increase in the higher CGT rate would reduce net Exchequer receipts by £870 million in 2028–29. A ten-point increase was estimated to reduce them by £3.565 billion. These are modelled scenarios, not observed losses following an enacted increase, and include interactions with Income Tax and Stamp Duty Land Tax.
HMRC’s own explanation is explicit: “Very large tax rate rises can reduce exchequer yield due to taxpayer behavioural impacts.” The same bulletin forecasts additional revenue from increases in several other taxes. The lesson is that the tax, its design and the scope for changing behaviour matter.
6. Why turn to landlords and savers?
The October 2026 Budget provides a topical illustration. From 6 April 2027, announced property and savings income rates are 24%, 44% and 49%: four percentage points above the current 20%, 40% and 45% rates. The latest Budget added two points to the two-point rise already announced in 2025. Savings rates apply UK-wide; the announced property rates apply in England, Wales and Northern Ireland, with devolved powers relevant to property income. See the Budget’s tax legislation overview.
My interpretation is that income from existing assets may look like a more dependable target than another hour of work that someone can simply decline. A rental property does not disappear when its owner receives a larger tax bill, and a saver still needs somewhere to keep the savings. That is an economic interpretation, rather than proof of the Government’s motive.
Neither group is unable to respond. Landlords can sell or change how they operate; savers can use ISAs and other investments. The OBR’s October 2026 forecast, paragraph 3.17, explicitly allows for behavioural responses reducing the expected annual yield of the latest increases by around £0.2 billion for savings and £0.1 billion for property income. It nevertheless forecasts positive additional revenue.
7. The Chancellor’s awkward question
My concern is that, for some taxpayers and some taxes, there may be less room for further increases than the headline rates suggest. Bunching and official behavioural costings are reasons to take that concern seriously. They do not establish that the UK tax system as a whole has passed the Laffer peak.
The question for any tax rise is therefore: after people change what they do, will the Government actually collect more?
A bigger percentage of a smaller pie is not automatically a bigger slice. Even the Treasury has to check the size of the pie.
Steve Watt · Chartered Accountant and Chartered Tax Adviser · 11 November 2026